Industrial
Industrial users have the ability to wirelessly monitor the many systems and processes as required by various local and government regulators. GoData can become a common platform to gain 24/7 access to such monitoring parameters as industrial effluent discharge, water usage, water quality, pump status, etc.
Water
Water systems both large and small are able to see the value in the GoData monitoring platform. Whether you’re a small utility requiring only a few water meter or pressure sensors; or a large City that needs to add a more complex remote monitoring system to your SCADA platform, GoData has a solution to meet your needs.
Drainage and Wastewater
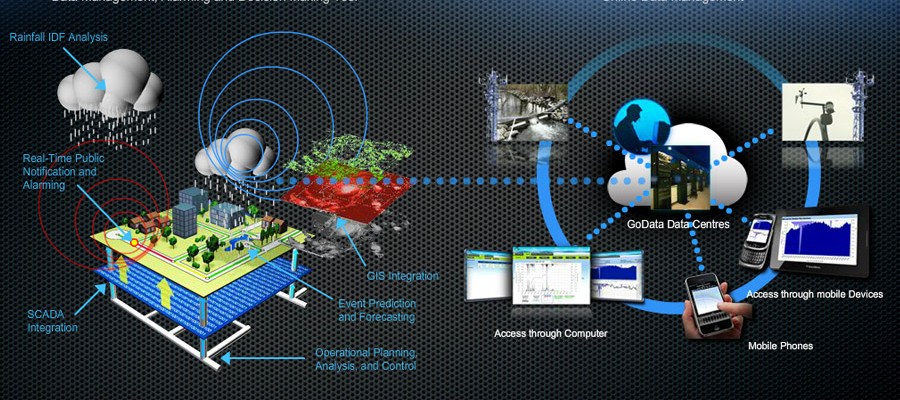
Hydrologic monitoring stations, rainfall and weather stations, temporary or permanent flow monitoring stations – These are just a few examples of data types that can be monitored wirelessly via the GoData platform. GoData allows engineers and other stakeholders to access their data when and how they want.